Feb 6, 2025
No Code Builder for Teams: A Visual Alternative to Excel, Sheets, and Notion Databases
 Jennifer Simonazzi
Traditional tools like Google Sheets and Excel work, until they don’t. As projects expand, so do the headaches: tangled formulas, fragile links, and outdated entries scattered across versions. That’s where the cracks show.
Now imagine a system where your data isn’t just stored; it works with you. No coding, no clunky spreadsheets. Just intuitive, visual databases designed to evolve with your projects. If your current setup feels like holding a house of cards, it’s time for something sturdier.
Why Excel, Sheets, and Notion Databases Can’t Handle Dynamic Team Workflows
Most database tools weren’t built for the pace of today’s projects. They demand rigid structures, relying heavily on manual inputs that leave room for error. A marketing team might juggle data in Excel, track progress in Google Sheets, and lose vital context hopping between both.
This fragmented workflow isn’t just inefficient—it’s risky. Errors slip through the cracks, outdated information lingers, and collaboration stalls. Teams spend more time fixing mistakes than driving projects forward.
A no code builder changes that narrative. Instead of fragile spreadsheets, it offers adaptable structures designed for evolving projects. Combined with the power of a visual database builder, teams can create, manage, and update data fluidly, without chasing scattered updates or dealing with error-prone formulas.
What to Look for in a No Code Database Builder for Teams
A visual database builder should feel like an extension of your team’s workflow, not a set of boundaries you have to work around. Instead of locking data into fixed templates, the right tool lets you shape, shift, and organize information as your projects evolve.
Key features to look for:
Drag-and-drop functionality that lets you structure data without writing code.
Real-time collaboration so updates happen instantly, keeping everyone on the same page.
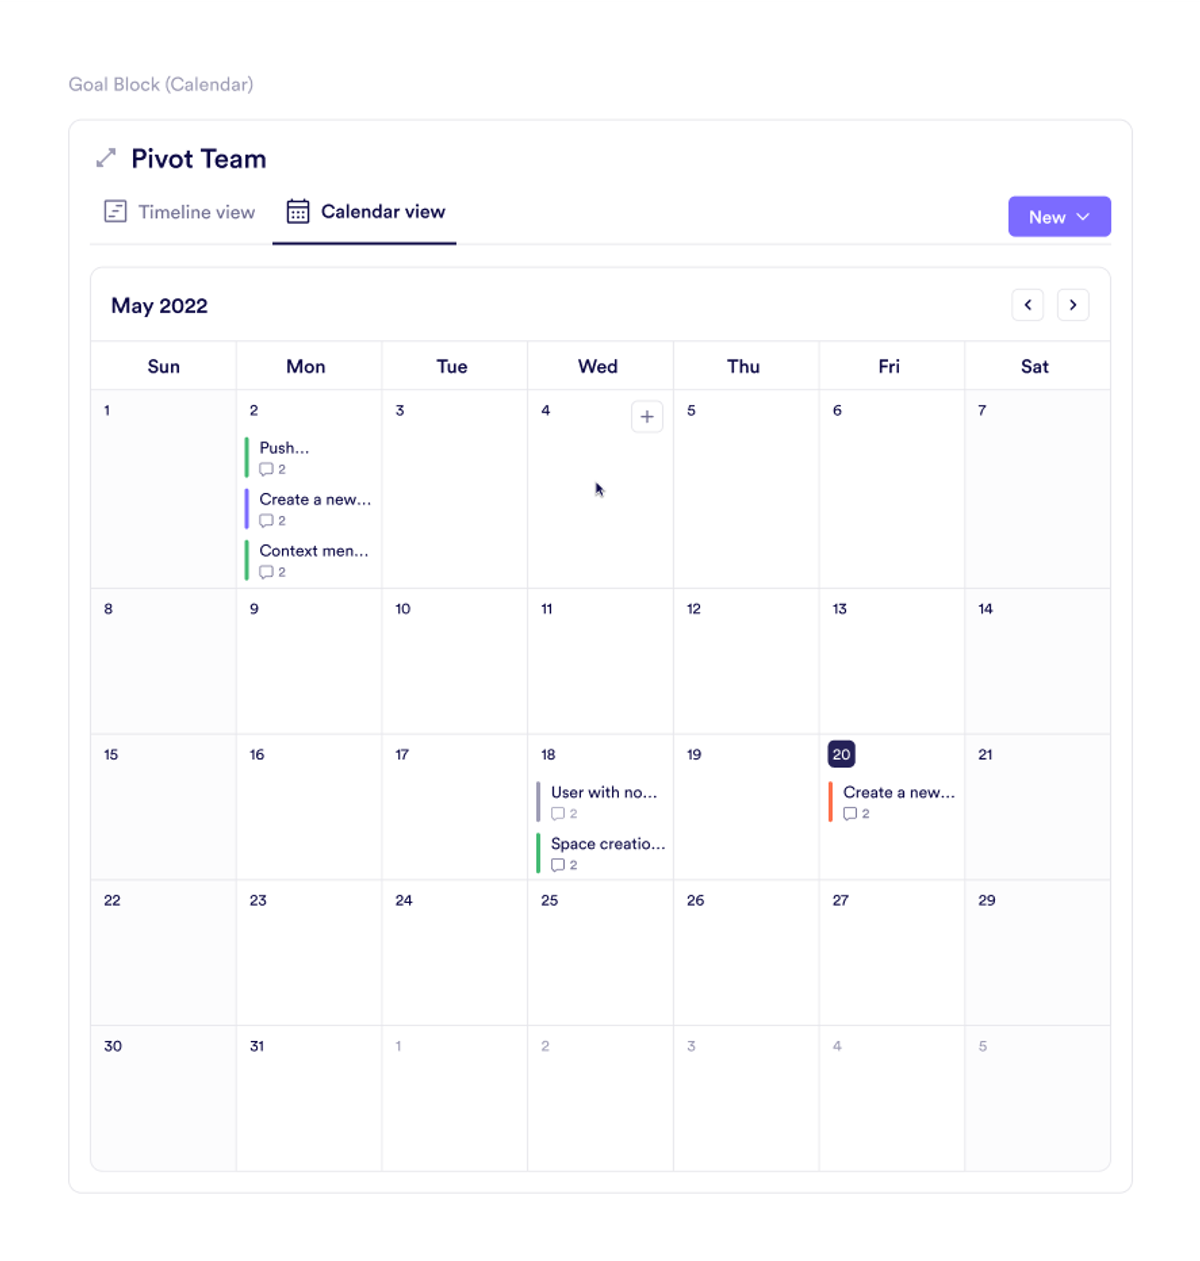
Customizable views like Kanban boards, calendars, tables, and charts that adapt to how you prefer to manage information.
Paired with the flexibility of a no code builder, these features create systems where data flows naturally, supporting your projects without getting in the way.
Pivot: A Visual No Code Database Builder for Flexible Team Workflows
Pivot helps teams manage data with more flexibility and context. As a visual database builder, it allows users to organize information without technical barriers.
Here’s what Pivot offers:
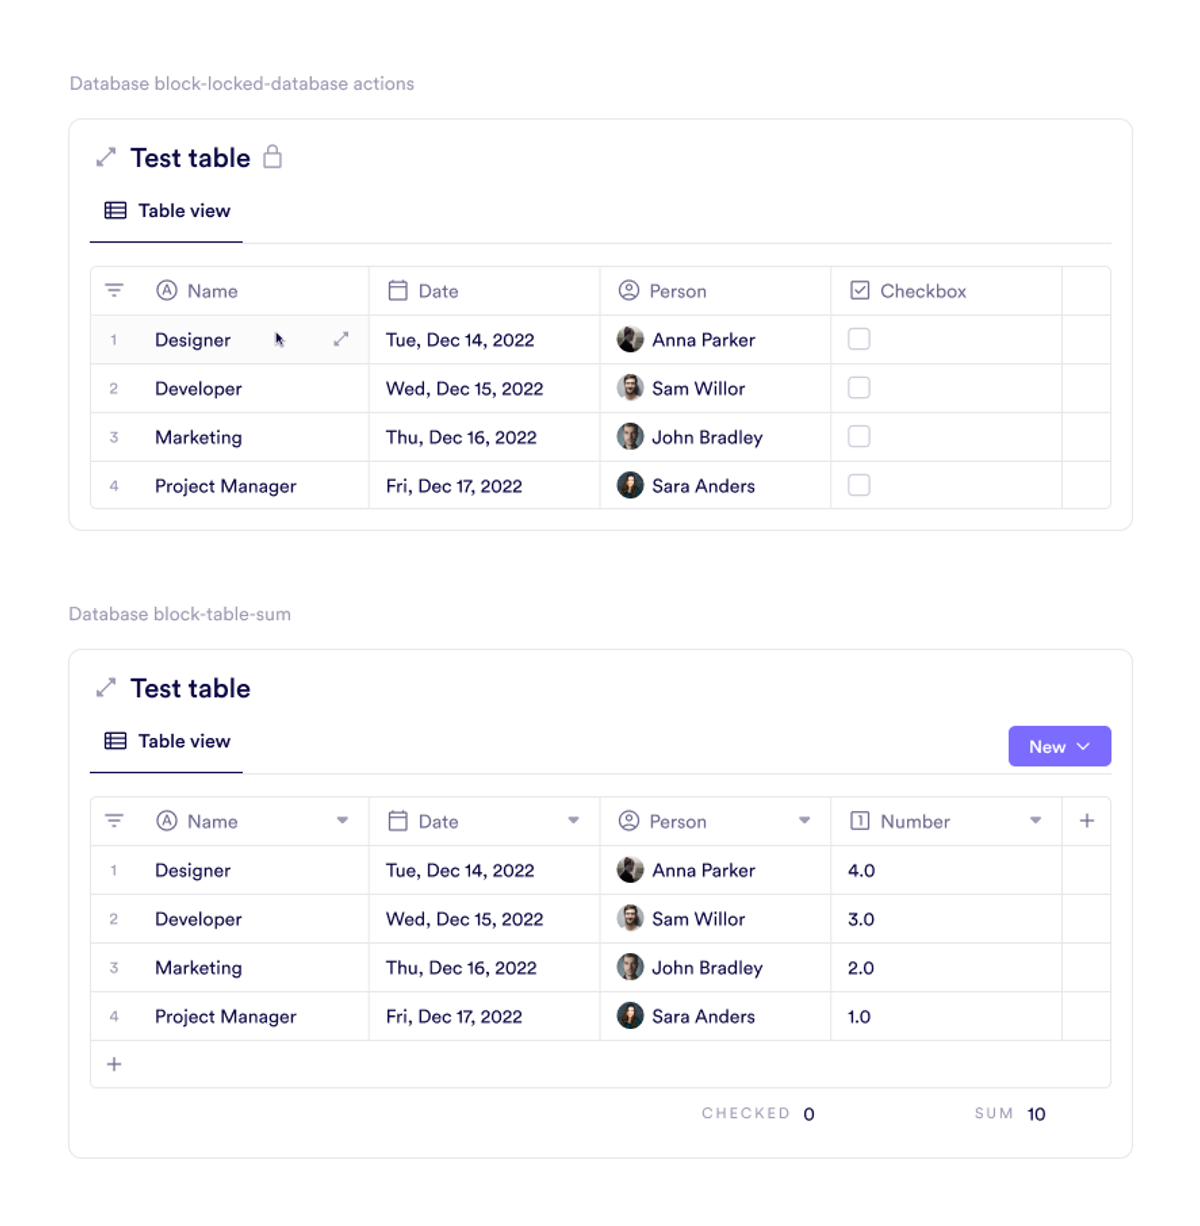
Databases: Build custom data structures with adjustable fields, filters, and views. Track projects, manage contacts, or monitor tasks with setups that fit how you work.
Charts: Turn raw data into visual insights. Use bar, line, pie, or table views to track metrics, spot trends, and understand performance at a glance.

Goals: Set objectives, assign responsibilities, and keep progress visible. Goals are tied to your data, making it easier to track outcomes without switching systems.
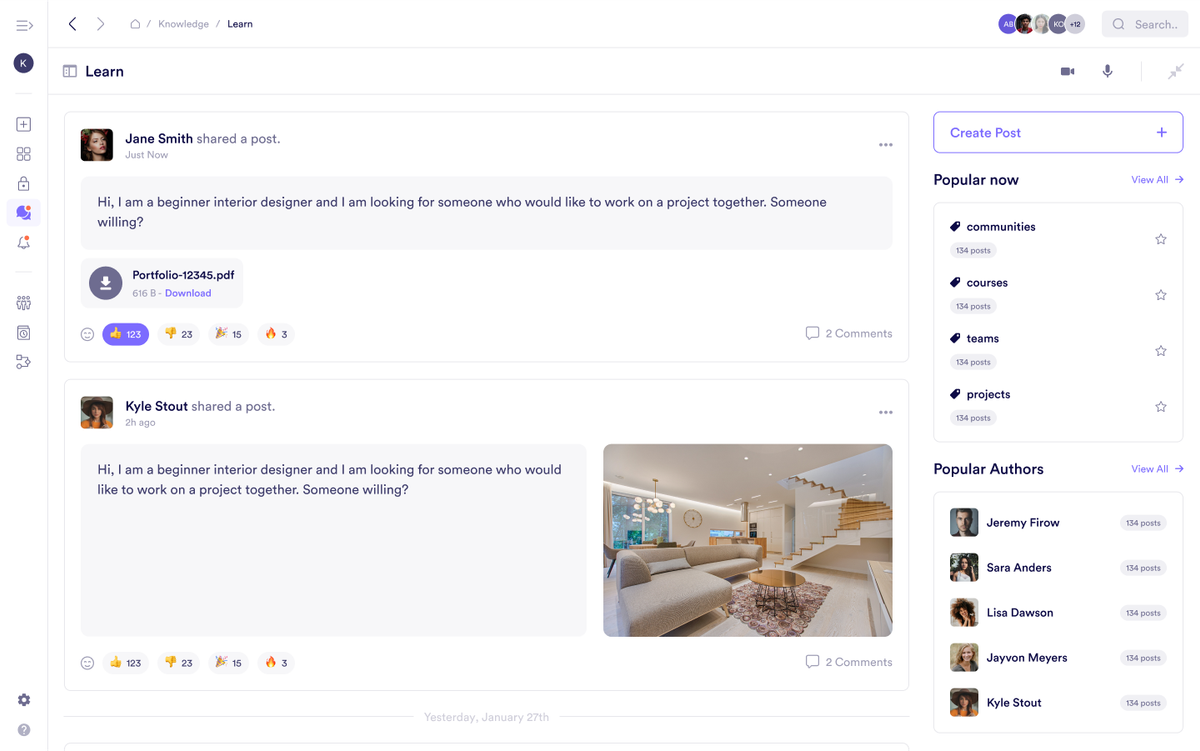
Post rooms: Keep data and discussions in the same place. Share updates, ask questions, and collaborate around your work without losing context.
Pivot bridges the gap between data management and collaboration, giving teams a fluid, adaptable environment that evolves with their projects.
Pivot vs Excel, Sheets, Notion: Why Pivot Works Better
Managing data with traditional tools often feels like patching gaps rather than building workflows that do what they’re supposed to. Here’s how Pivot offers a fresh approach compared to familiar names in the space:
Breaking free from grids: Pivot vs. Google Sheets
As a Google Sheets alternative, Pivot moves beyond static rows and columns. While Google Sheets handles basic data well, it struggles with complex workflows that need more than manual updates. Pivot lets teams organize information dynamically, linking data directly to discussions and tasks. No more juggling between sheets and chats—everything stays connected.No formulas, no fuss: Pivot vs. Excel
Excel has long been the go-to for data crunching, but it demands mastery of formulas and functions. Pivot is an Excel alternative that simplifies this with intuitive views and automated tracking. Whether managing projects or databases, you won’t need to rely on error-prone formulas to get work done.More than notes: Pivot vs. Notion Databases
Notion is great for note-taking, but its database features can feel limited when managing complex data. As a Notion database alternative, Pivot integrates advanced tracking with real-time collaboration. Databases, charts, and goal tracking live alongside discussions, giving teams the flexibility to work and communicate without switching contexts.Flexible without the limits: Pivot vs. Sortable
Sortable helps organize information, but its views can box teams into specific workflows. Pivot offers flexibility as a Sortable alternative, allowing you to customize views—tables, lists, calendars, and charts—based on your needs. Whether you’re tracking leads, projects, or inventory, Pivot adapts without forcing you into predefined formats.Modern data management: Pivot vs. SharePoint Lists
SharePoint Lists were designed for enterprise data management but often feel clunky and outdated. As a SharePoint Lists alternative, Pivot provides modern, intuitive data organization with the added benefit of real-time collaboration. No complex setups or IT dependencies—just clear, adaptable data management for teams of any size.
These platforms weren’t built with today’s dynamic workflows in mind. Pivot shifts the focus from managing data in isolation to creating a connected, adaptable workspace where projects, people, and information move together.
Try Pivot: The No Code Builder That Turns Data into Action
With Pivot, a no code builder becomes a canvas where information flows, projects grow, and ideas take shape. The visual database builder lets you see not just numbers, but the story behind them. Ready to turn chaos into clarity? Let Pivot show you how HERE.
Jennifer Simonazzi
Content Writer
Share this post
Table of Contents
Subscribe to never miss out on updates and inspiration
Watch new Pivot tutorials, attend live training sessions, and get access to exclusive new features.