Goals Dashboard
Organize and manage goals effectively with a custom dashboard in Pivot. Set objectives tailored to your team’s needs, monitor progress in real time, and use insights to refine strategies. Create an organized system that keeps your team focused, engaged, and achieving their objectives.
Keeping objectives visible and easy to act on changes how a team moves. When targets, owners, and updates live in one hub, people know where to look, what to do next, and how their work contributes to the plan. Pivot lets you assemble that hub with goal blocks, pages, databases, post rooms, chat rooms, chart blocks, and space analytics, so your dashboard becomes a daily habit rather than a slide deck no one opens. It supports team communication, works for async work, and behaves like a dependable work platform for teams that care about delivery.
Design Your Goal Dashboard For Team Productivity
Begin inside a dedicated space for your group. Create a homepage that acts as the dashboard surface: the top row shows this quarter’s goal blocks, the next row links to active plans, and a final row shows a few chart blocks pulled from the work underneath. Keep the copy short. Title each section with a verb and the outcome you expect, for example Hit Qualified Leads Target or Improve Onboarding Completion.
A simple structure works well:
a goals section with two to four goal blocks
a links section pointing to sprint pages, briefs, and runbooks
a metrics section with charts sourced from your project databases
a updates section that surfaces the latest post room threads
Now anyone can scan the page in a minute and understand direction. This raises team productivity without adding another report.
Define Objectives With Goal Blocks
Write targets in plain language. Each goal block should name the outcome, the measures you will watch, the owner, and the target date. Keep measures specific and few. Examples:
Increase trial-to-paid conversion from 12% to 16% by June 30
Reduce average first response time to under 4 minutes in support chat
Ship mobile onboarding revamp to 100% of new users with a 20% lift in completion
Place these blocks at the top of the dashboard and mirror them on the relevant project page so the same goals appear where the work happens. Because goal blocks are native, you can comment, update measures weekly, and keep a short change log that future readers can follow.
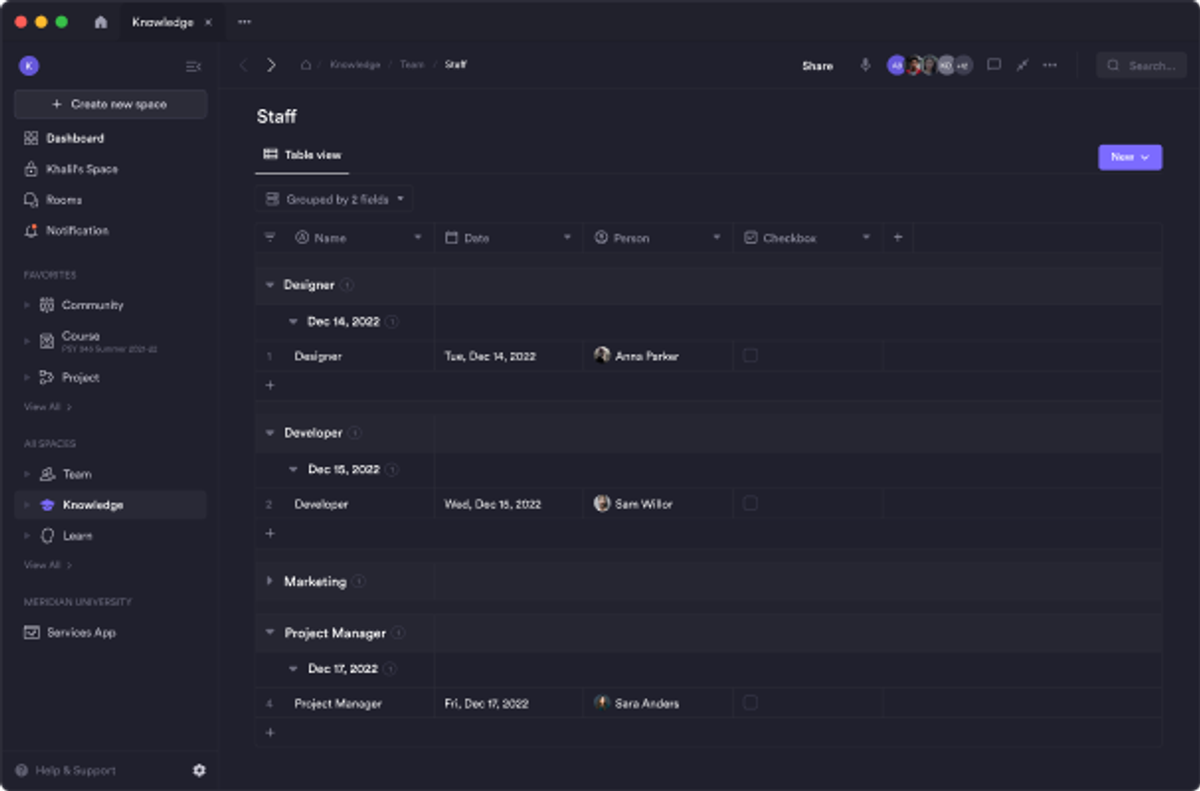
Structure The Dashboard By Teams And Projects
People find goals faster when the layout mirrors how they work. Use pages to group objectives by stream: Product, Marketing, Sales, Support, Operations. Inside each page, nest child pages for live initiatives. If your organization runs multiple campaigns, create a database named Initiatives with fields like owner, status, start date, target date, KPI, and link to page. Each initiative entry opens as its own page, which keeps details deep without bloating the dashboard.
This page-plus-database pattern scales as headcount grows and supports team collaboration tools across departments without forcing everyone into the same view.
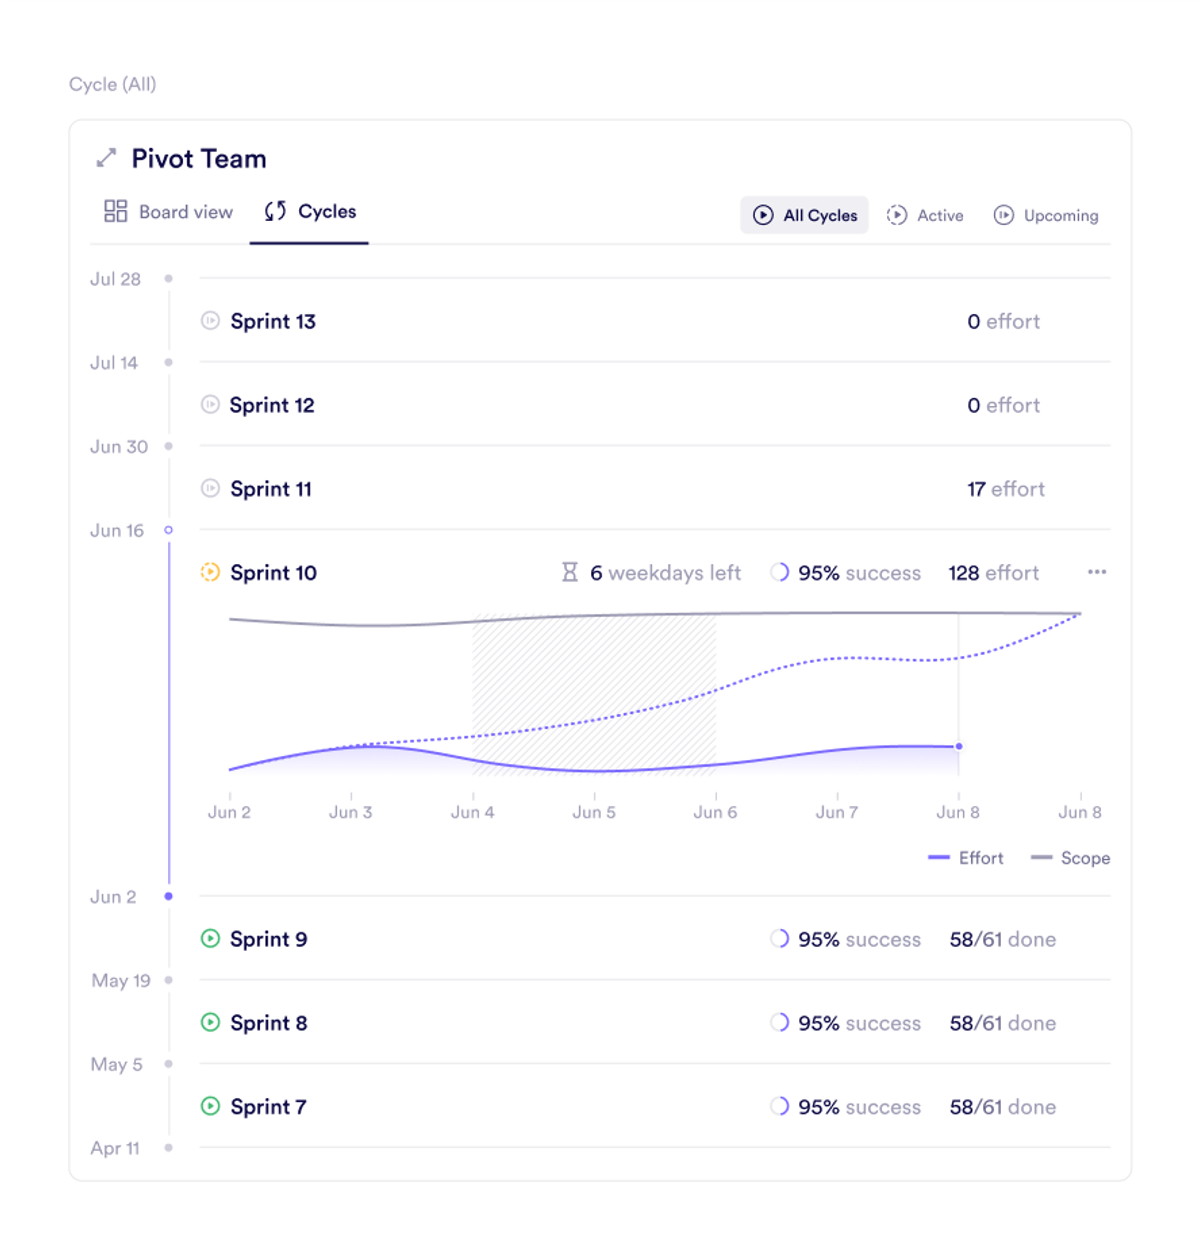
Make Progress Visible With Analytics And Charts
Visuals help people grasp what moved this week. Add chart blocks to your dashboard that draw from your initiative database or other tracked data:
a bar chart by initiative showing percent complete
a line chart of a key KPI over the quarter
a stacked chart by owner that reveals workload or burn-down
Open space analytics to learn which pages people actually read, which rooms drive follow-up, and when activity spikes. If the dashboard gets traffic but a specific initiative page does not, pin that page higher or tighten the copy. This is team productivity software without the overhead of a separate BI tool.
Assign Ownership And Deadlines In Databases
Accountability stays firm when tasks and dates are visible. Create a database called Milestones with fields for initiative, owner, due date, status, and link to artifact. Filter the database on each initiative page so owners see only what belongs to them. Sort by due date for standups. When a milestone closes, add one sentence describing the outcome and paste the link to the commit, deck, or recording.
For cross-functional launches, build a compact RACI table in the same database or on the page. Readers should leave the page knowing exactly who to ask and when to expect the next checkpoint.
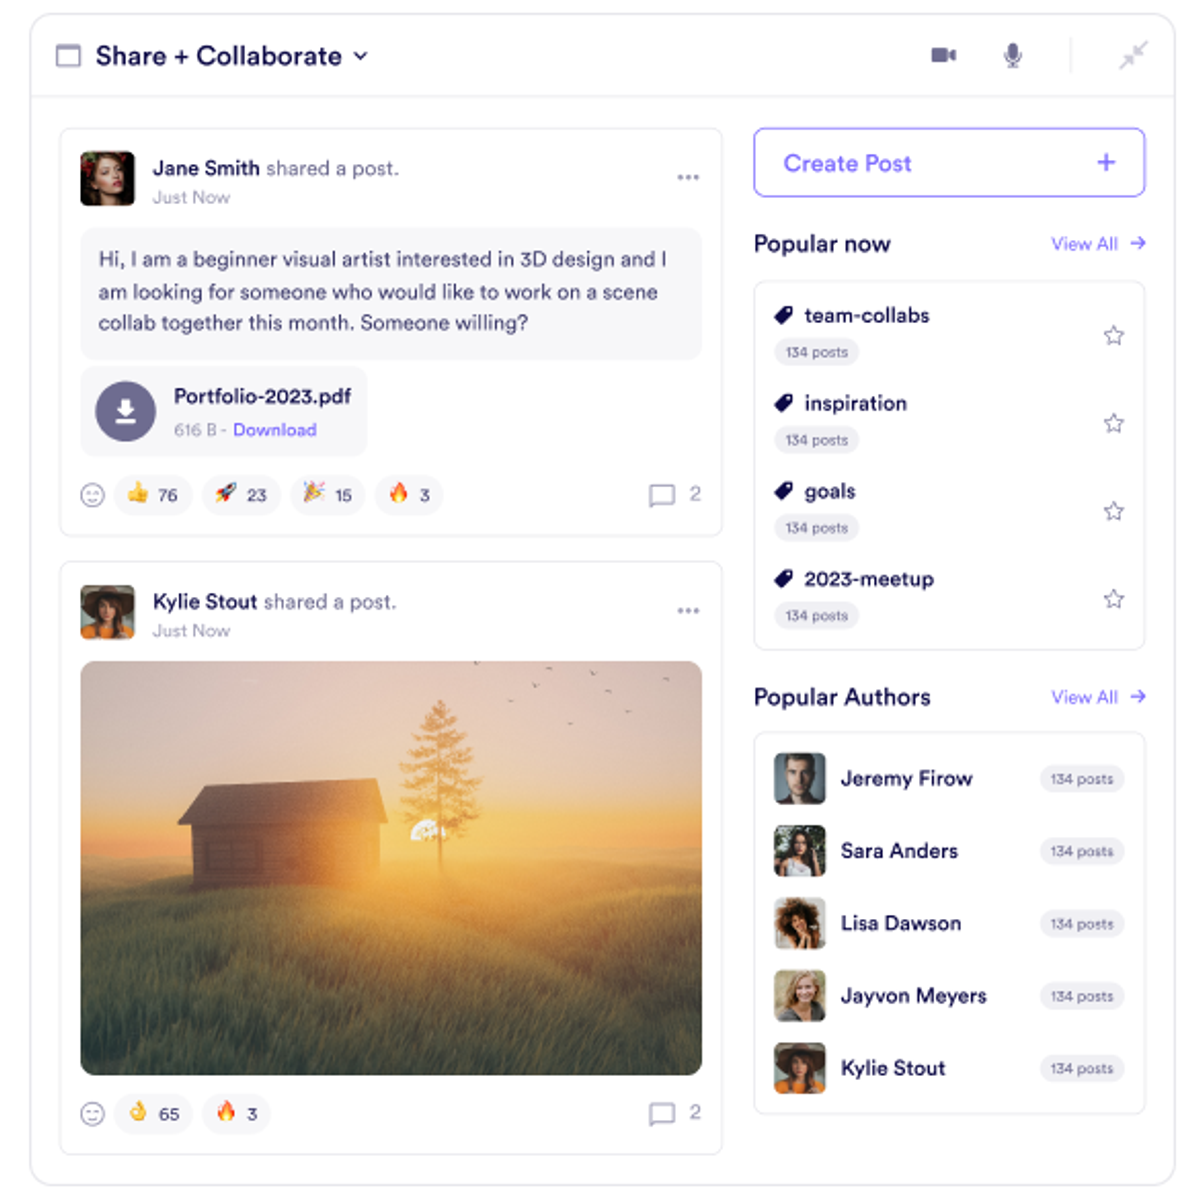
Keep Updates Flowing With Team Communication
Write progress where everyone expects to read it. Use a post room for weekly updates with a pinned template: what shipped, what is next, where help is needed, links. Leads reply by day’s end with decisions or nudges. The thread becomes the record. Short questions land in a chat room thread and end with a one-line outcome that you also paste on the relevant page.
When a choice needs to close, attach a poll to the update. If tone or a sketch would help, jump into a video room or audio room, record, and clip the two minutes that matter. Pin the clip under the post so people who were offline find the exact moment to watch. This is practical async communication for teams that span time zones.
Use Live Document Editing For Specs And Reviews
Plans evolve as you learn. Keep specs and briefs on pages and invite comments through live document editing. Reviewers annotate in context; authors update with a short note. Because the document lives next to its goal block and milestones, the narrative stays intact. Newcomers can read the page, skim the update thread, and understand how the work connects to the target in minutes.
Build A Dashboard People Actually Use
A good goals dashboard is not decoration. It is a working surface for priorities, updates, and visible ownership. With Pivot, goal blocks, charts, rooms, pages, and analytics all sit in the same place, so the team can read direction and act on it without switching systems.
Start with one space, one homepage, and a few clear goals. The habit builds from there.
Table of Contents
Create your own Knowledge Base
Experience the power of synchronized collaboration
Collaborate globally, instantly, together
Bring versatility to your course design
Blend community with content and learning
Unite internal and external teams
Consolidate wikis, projects, and messaging
Try dynamic multi-modal collaboration